Awaiting analysis…
Baseline Option
--
Active Option
--
Facade dossier
Awaiting site analysis
The report narrative will appear here after the first analysis.
Climate profile
Monthly precipitation with design temperatures.
Psychrometric chart
ASHRAE 55 thermal comfort profiling from hourly data.
3D facade model
Building orientation viewer
Faces coloured by overall orientation severity. Drag to rotate, scroll to zoom.
Wind rose
Directional exposure from the forecast snapshot.
Orientation severity matrix
Facade severity by orientation and risk category.
Orientation table
Facade matrix by elevation
Use this ledger to isolate the governing elevations.
| Orientation | Solar | Wind | Rain | Condensation | Overheating | Overall |
|---|
WWR split
Detailed Façade Takeoff
Calculated areas and glazing ratios by orientation, resolving exact takeoff figures.
| Orientation | Gross Area (m²) | Glazing Area (m²) | Opaque Area (m²) | Window-to-Wall Ratio (%) |
|---|---|---|---|---|
| Awaiting analysis... | ||||
Risk register
Engineering severity register
| Category | Score | Band | Basis |
|---|
Hygrothermal condensation gradient (Glaser 1D)
Interfacial temperatures and vapour pressures vs saturation limits at coldest winter month conditions.
Thermal Bridges
2D Junction Condensation Risk (fRsi)
Local temperature factors (fRsi) splayed over slab and reveal linear bridges compared to ISO 13788 Annex A limits.
| Junction Type | Psi / Chi Value | Effective U-value | fRsi Factor | fRsi Limit | Verdict |
|---|---|---|---|---|---|
| Awaiting analysis... | |||||
Awaiting analysis…
Awaiting analysis…
Recommended actions
Next design moves
Target the early facade decisions that matter most.
Initial Embodied Carbon
--
Annual BIPV Generation
--
Annual Carbon Avoided
--
Carbon Payback Period
--
Whole-Life Facade Carbon Payback Amortisation
Cumulative embodied and operational carbon over a 30-year lifecycle.
Net Zero Carbon Pathway 2025–2050
Annual facade operational CO₂e under three IEA grid decarbonisation scenarios.
Whole-Life Carbon Waterfall (A1–A3 + B6 + C3/C4)
Includes A1–A3 embodied carbon (manufacture and transport), B6 operational energy, C3/C4 end-of-life, and D (BIPV offset). Reported as net whole-life CO₂e over the design life.
| Life-Cycle Stage | kg CO₂e |
|---|---|
| Awaiting analysis… | |
BIPV Orientation Yields
| Orientation | Gross Facade | PV-Usable | Active BIPV | Annual Yield |
|---|---|---|---|---|
| Awaiting analysis... | ||||
Smart Glazing (Electrochromic) Viability
| Orientation | Viability Index | Recommendation |
|---|---|---|
| Awaiting analysis... | ||
Carbon mitigation advisory
Envelope decarbonisation strategy
Code Checks
--
LEED Points
--
BREEAM Credits
--
Testing Protocols
--
Building Regulations Compliance Checklist
Primary checks are the applicable legal requirements for the detected project jurisdiction. Reference benchmarks are international standards shown for comparison; they are not governing law for this location.
| ID | Jurisdiction | Standard | Description | Value | Threshold | Result |
|---|---|---|---|---|---|---|
| Awaiting analysis... | ||||||
Bracket & Anchor Bolt Design
EN 1993-1-8:2005 / EN 1999-1-4 tributary area method. Grade 8.8 bolts, EN AW-6063-T6 aluminium arm.
Differential Movement & Joint Sizing
References CWCT TN30, ETAG 002 Part 1 Section 4.3, and EN 15434. Weather seals are sized for thermal movement; drift is accommodated by bracket slots.
Awaiting analysis…
LEED v4.1 / BREEAM NC 2018 Credit Assessment
Voluntary certification contributions for facade-relevant credits only. Not a substitute for a full LEED or BREEAM assessment. Both schemes are globally applicable regardless of project jurisdiction.
| ID | Scheme | Category | Credit | Max | Achieved | Status |
|---|---|---|---|---|---|---|
| Awaiting analysis... | ||||||
Facade Testing Protocol Matrix (CWCT TN41)
| ID | Test | Standard | Pressure (Pa) | Mandatory |
|---|---|---|---|---|
| Awaiting analysis... | ||||
NBS-Style Performance Specification
Numbered work-section clauses (01 Scope / 02 Standards / 03 Performance / 04 Materials / 05 Testing / 06 Documentation) derived from concept analysis. Not for construction without professional sign-off.
Awaiting analysis…
Deliverables
Project export dashboard
Generate the concept-stage PDF dossier, orientation matrix, or full analytical payload for design reviews, options studies, and internal QA records.
Engineering Predesign PDF
Concept dossierConcept report with climate, wind, moisture, carbon, and orientation charts.
Orientation Matrix CSV
Spreadsheet FeedOrientation score table for facade zoning and option comparison.
Full Analytical Payload JSON
API-CompatibleFull structured payload for audit trails, integrations, and QA review.
Save Project
Input snapshotDownload all project inputs as a .fiq.json file to restore later or share with a colleague.
Load Project
Restore inputsOpen a .fiq.json file to restore all inputs and re-run the analysis automatically.
Onboarding & reference
FacadeIQ User Guide
Learn how to navigate inputs, set material options, and evaluate climate and performance reports.
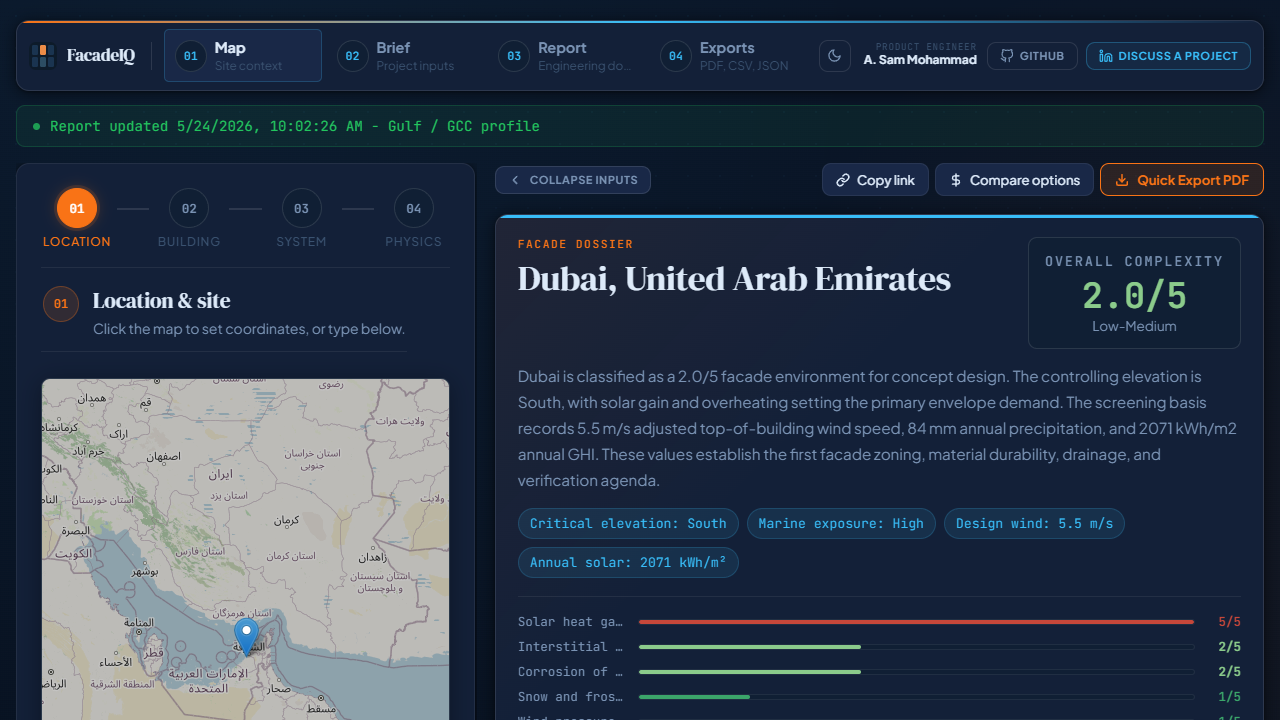
Step 1 Select the Site Location
Start by establishing the geographic coordinate base of your project. You can click anywhere on the interactive map to place a pin, or enter precise coordinates manually in the sidebar inputs. The platform will automatically query real-time elevation datasets, coastline proximity maps, and regional weather climatology profiles (such as annual solar Global Horizontal Irradiation and design wind speeds) for the site.
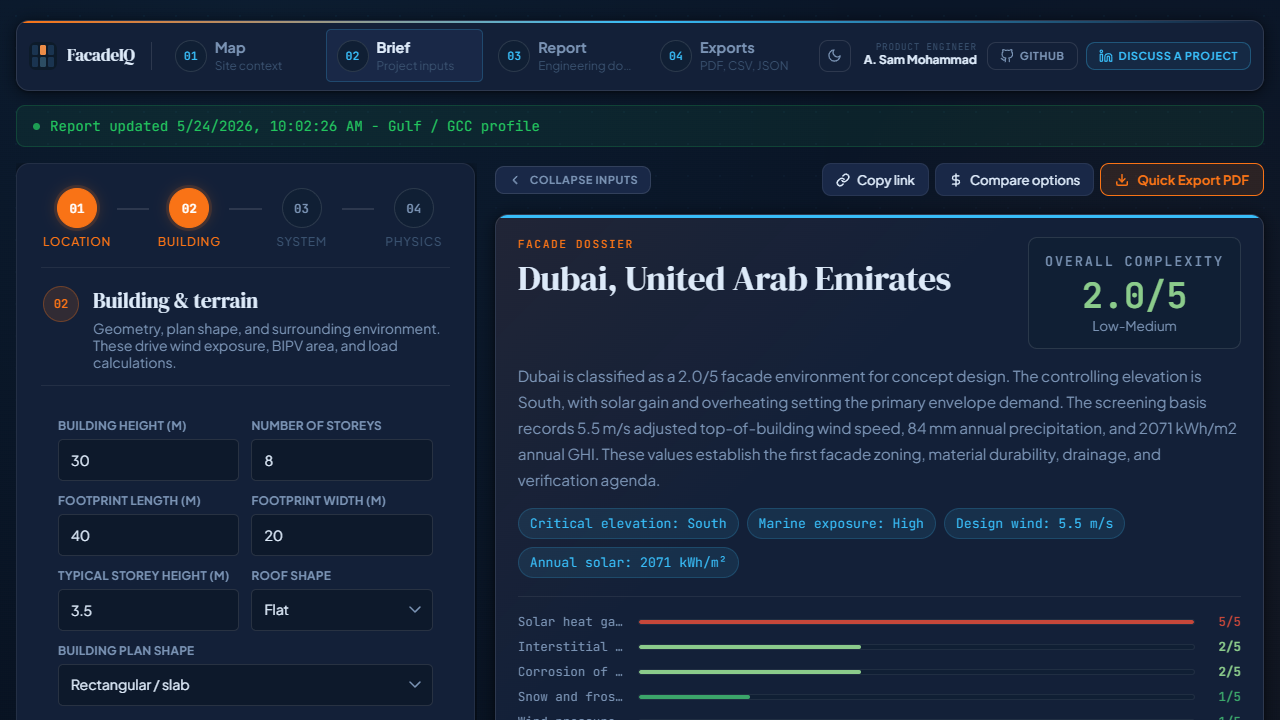
Step 2 Define the Building Envelope & Terrain
Configure the building's geometry and surrounding local environment parameters in Step 2. Input the building height, typical storey heights, footprint length and width, and select the plan shape. These inputs are processed by the geometric takeoff engine to calculate orientation-specific gross facade areas, and by the wind pressure calculator to estimate boundary layer exposure constants:
- Terrain Category: Determines ground friction boundary layer profile according to Eurocode (EN 1991-1-4) or ASCE 7 exposure constants. Selecting Category 0 represents open coastal exposure with maximum wind speeds, whereas Category IV represents a dense urban core where neighboring structures break up the airflow, reducing pressures.
- Urban Density: Modulates local microclimate shielding. Choosing "Dense Urban / City Centre" applies a local wind exposure dampening multiplier (ranging from 1.0 down to 0.80), directly softening structural load deflection requirements.
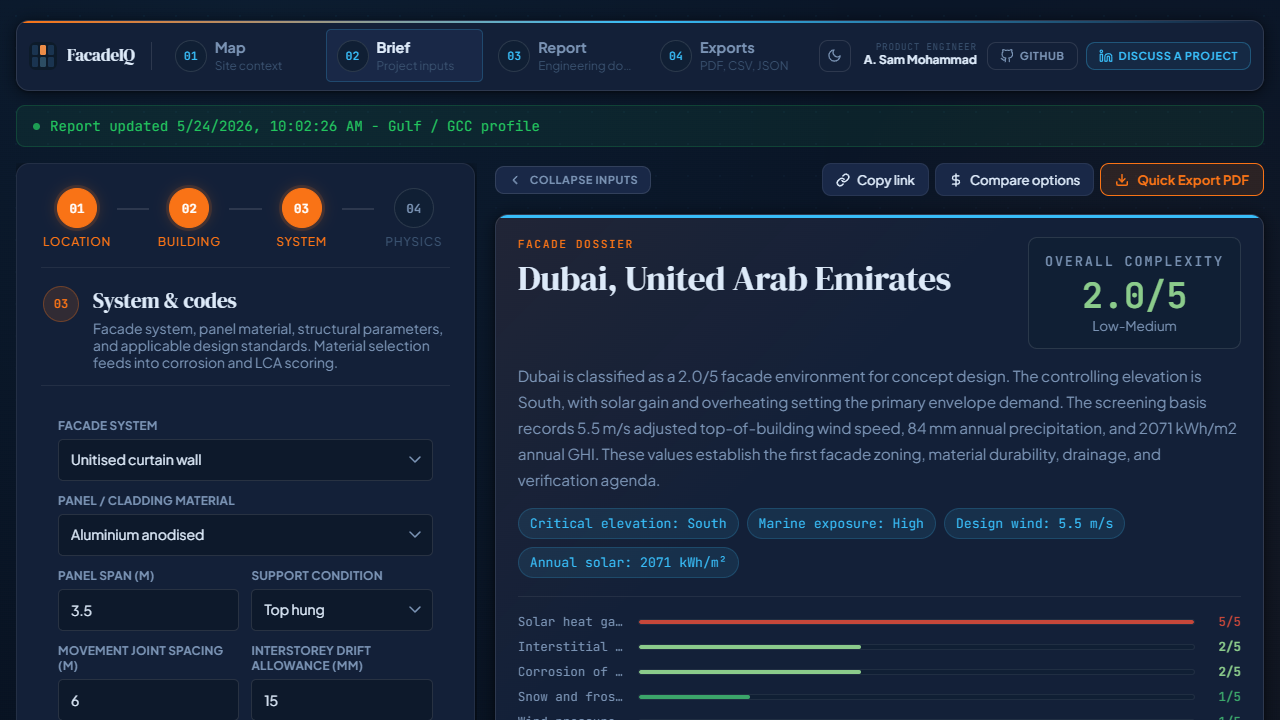
Step 3 Specify Facade Systems & Material Rules
FacadeIQ utilizes a dual-system framework, managing transparent vision zones and solid spandrel zones independently to allow modern complex envelope designs:
- Glazing / Vision System: Set options like Unitised curtain wall, Stick framing, or Structural sealant glazing (SSG). This selection governs transparent U-value targets, active daylight transmissivity targets, framing solar heat gain coefficient (SHGC) limits, structural sealant bite sizes, and seismic joint displacement ratings.
- Opaque Facade System: Choose construction assemblies such as Rainscreen cladding, Composite panels (ACM), Precast concrete / GFRC, or Insulated metal panels (IMP). This selection governs the solid U-value baseline, acoustic transmission mass (Rw), Glaser build-up defaults, and Stage A1-A3 embodied carbon intensities.
- Opaque Cladding Restrictions: Cladding materials are dynamically filtered based on the opaque facade system. For example, selecting Precast concrete / GFRC restricts choices strictly to mineral options (GFRC, Stone, or Not specified) to prevent physically impossible combinations like a timber cladding precast concrete assembly.
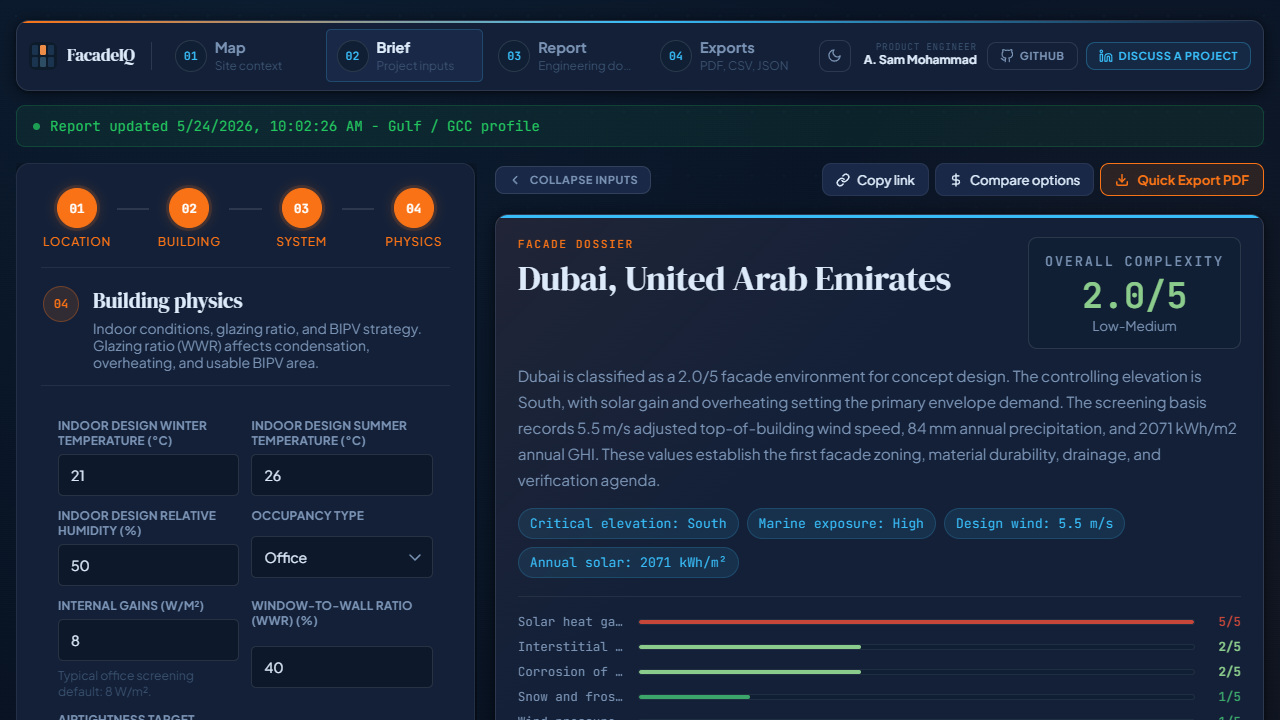
Step 4 Set Environmental Physics & Custom Glaser Layers
Configure internal thermal targets, occupancy loads, and airtightness targets. Adjust the Window-to-Wall Ratio (WWR) overall or per orientation. The opaque areas are dynamically derived as the remainder, automatically updating the gross area takeoff displays.
To model hybrid envelope build-ups or custom insulation layers, use the Custom Layer Stack tool. This overrides system-type physical lookups in Glaser vapor condensation risk calculations:
- Sequential Order: Enter layers strictly from the indoor (warm side) to the outdoor (cold side). The first row should represent the internal lining (e.g. gypsum board) and the final row represents the external rainscreen or cladding panel.
- Physical Thickness (mm): Input the physical thickness of the layer in millimeters.
- Thermal Conductivity (Lambda, W/m·K): Define the material's thermal conductivity. Lower values (e.g. 0.035 W/m·K for mineral wool insulation) provide higher thermal resistance (R-value).
- Vapour Resistance Factor (Mu, μ): Enter the dimensionless vapor resistance factor. An open layer like mineral wool has a μ of 1 (highly breathable), whereas a perfect vapor barrier has a very high factor (e.g. 100,000 or more).
- Stack templates: Click "Use typical stack" to instantly pre-populate a high-performance rainscreen sequence (plasterboard, vapor barrier, mineral wool, air cavity, and rainscreen panel) as a reference point you can fine-tune.
Step 5 View the Interactive 3D Model
Once your inputs are configured, the platform runs the analysis automatically. You can explore the fully interactive 3D model in the results panel. The viewer highlights the active orientation faces and overlays the corresponding WWR glazing splits, allowing you to visually cross-reference geometry takeoff results immediately.
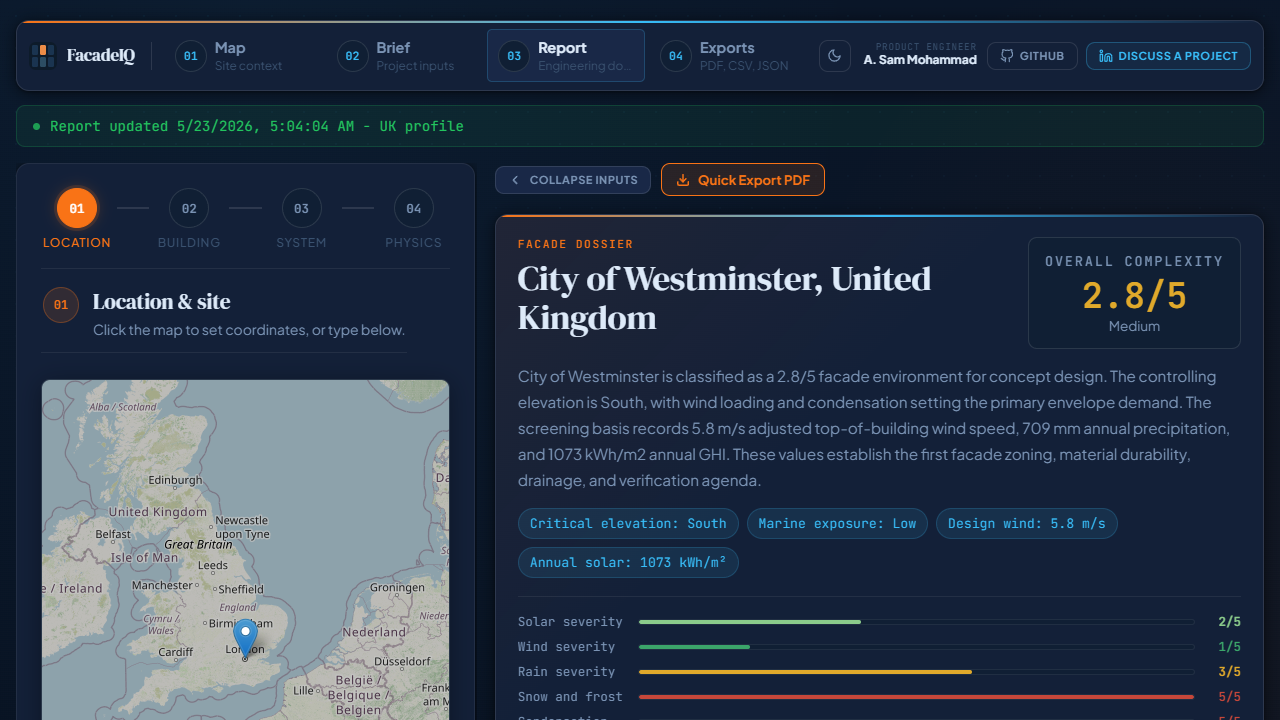
Step 6 Analyze Performance & Decarbonization Reports
Switch between the detailed analysis tabs to check engineering performance. The platform calculates structural design wind pressures, monthly condensation risk cycles, BIPV solar yields, and whole-life carbon payback trajectories comparing standard material baselines against low-carbon, recycled-content specifications.
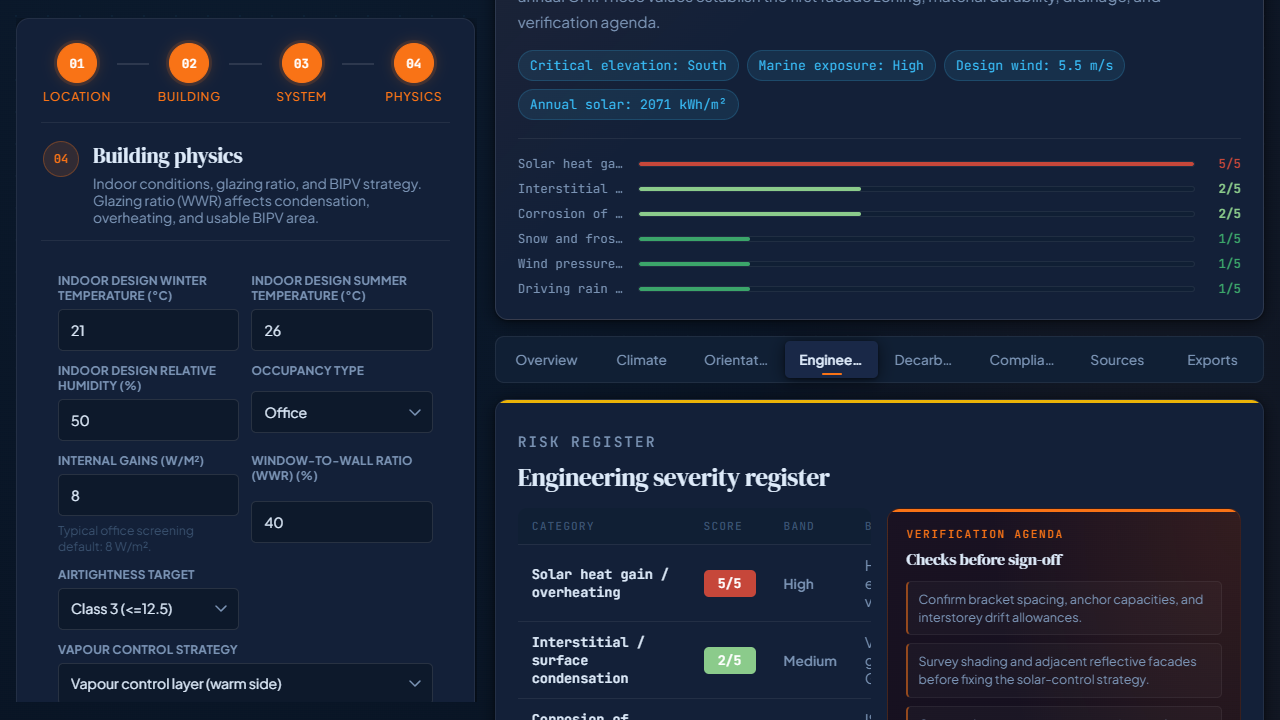
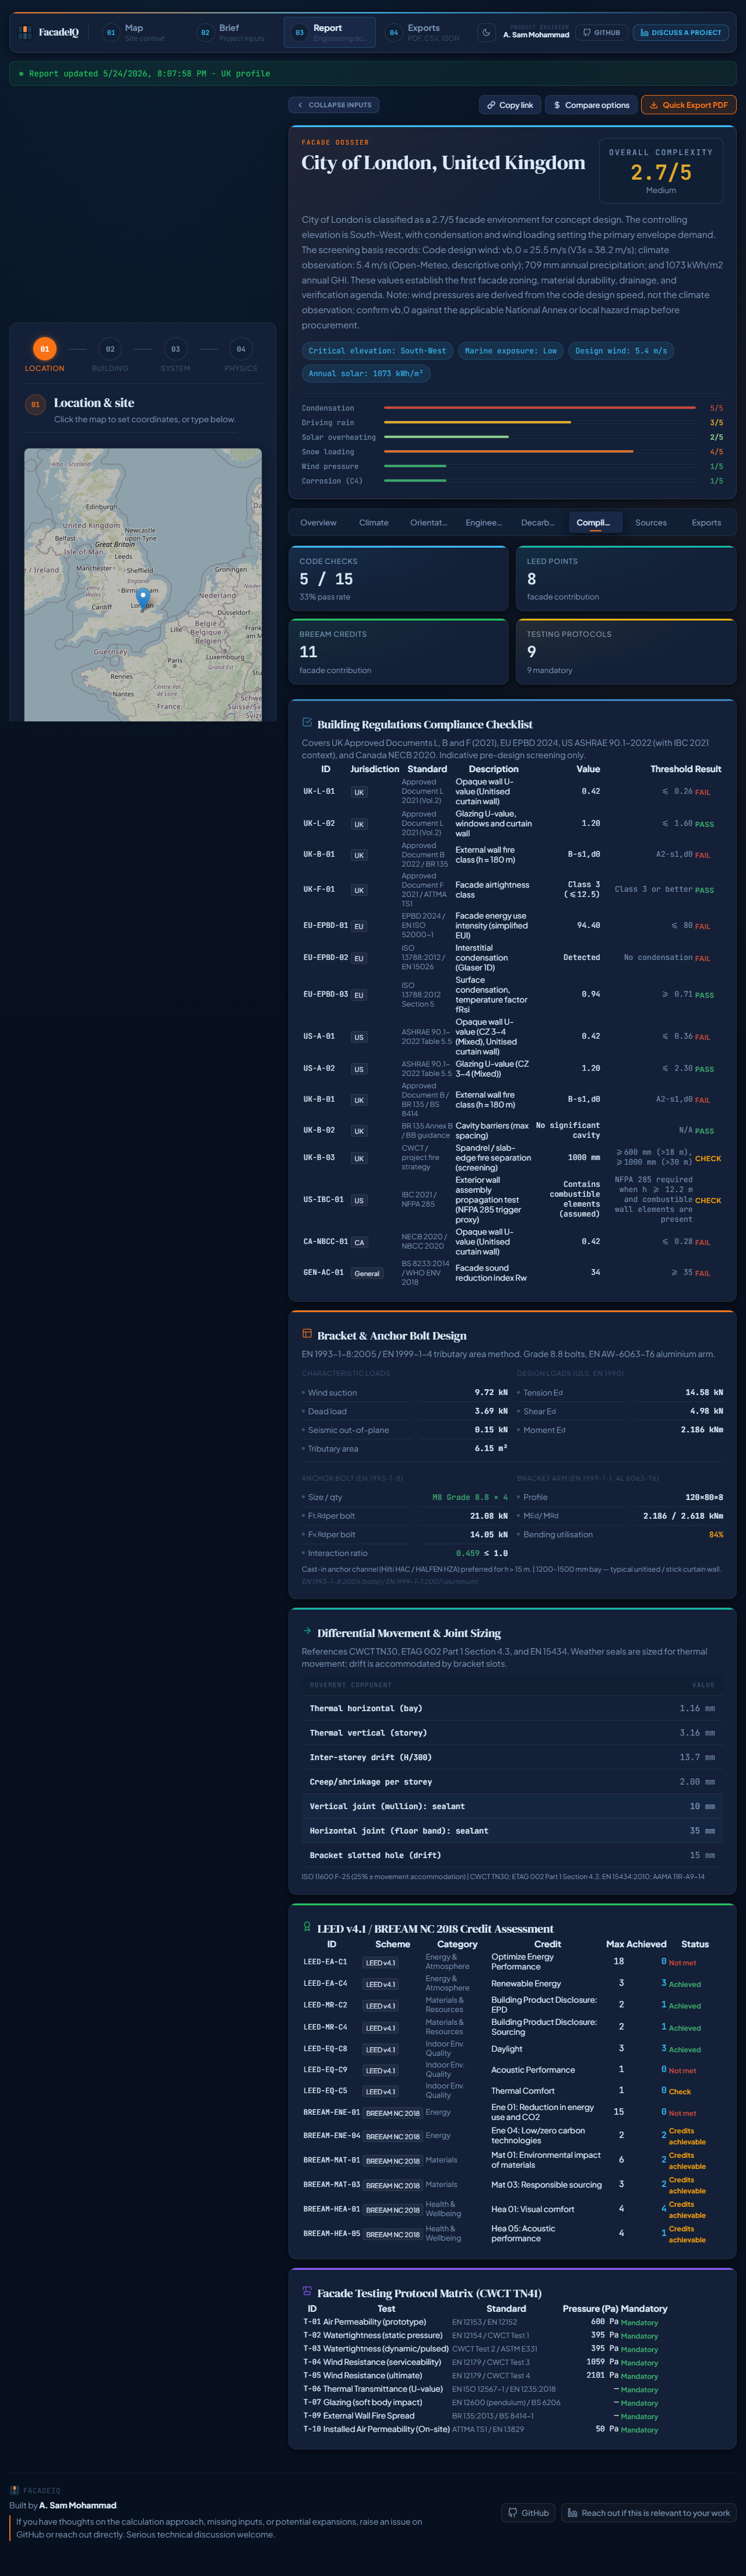
Step 7 Review the Automated Compliance Matrix
Check the Compliance tab to verify code conformance automatically. The app generates clear checklist items evaluating structural joint limits, fire safety ratings, local energy code targets, and provides immediate outline specifications and outline recommendations to feed directly into your predesign dossiers.
Predesign Dossier Quick Tips
Targeting Low-Carbon Trajectories
Toggle the "Specify low-carbon materials" option in Step 4. This updates the LCA module with recycled aluminum and lower-impact insulation baselines, calculating carbon payback periods under a 30-year lifecycle.
Location-Based Auto-Sanitation
When coordinates are shifted, Nominatim and NASA POWER refresh automatically. Proximity coast limits and regional design codes recalculate seamlessly in the background without user intervention.
Exporting Deliverables
Use the Exports tab to download rich ReportLab PDF reports, detailed engineering JSON payloads, or orientation-specific area CSV spreadsheets to share directly with project stakeholders.